


Density Altitude Chart
Take off and landing performance figures are based on sea level air density at standard temperature (59`F). As elevation increases, temperature decreases at a standard rate. Air becomes less dense, resulting in lower performance figures. Temperatures varying from standard can have drastic additional effects on take off, landing, and climb out performance. A 5,000 ft. elevation airport can suddenly become a 10,000 ft. elevation airport as far as air density is concerned. This is operational or density altitude-the calculated altitude of the air in which the airplane operates and is very important when using high elevation and/or short runway airports.
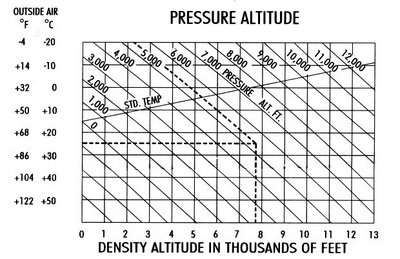
(Dashed lines on chart above illustrate example.)
HOW TO USE THIS CHART:
To determine conditions at airport you plan to use:
- Enter actual airport altitude on diagonal lines marked "Pressure Altitude" (example: 5,500 ft.).
- Enter airport temperature along horizontal lines (example: 77`F.).
- Carry temperature line to right until it crosses diagonal line (airport altitude).
- From this point, drop a vertical line to bottom of chart. Read operational or density altitude (example: 7,700 ft.).
posted by Alex Hammer | 12:43 PM
![]()
![]()
0 Comments:
Post a Comment
<< Home